Evil Charts: React chart components
Free, open-source animated React charts built with Recharts, Apache ECharts, shadcn/ui, and Tailwind. I open it when a dashboard needs a chart that matches the rest of the UI.
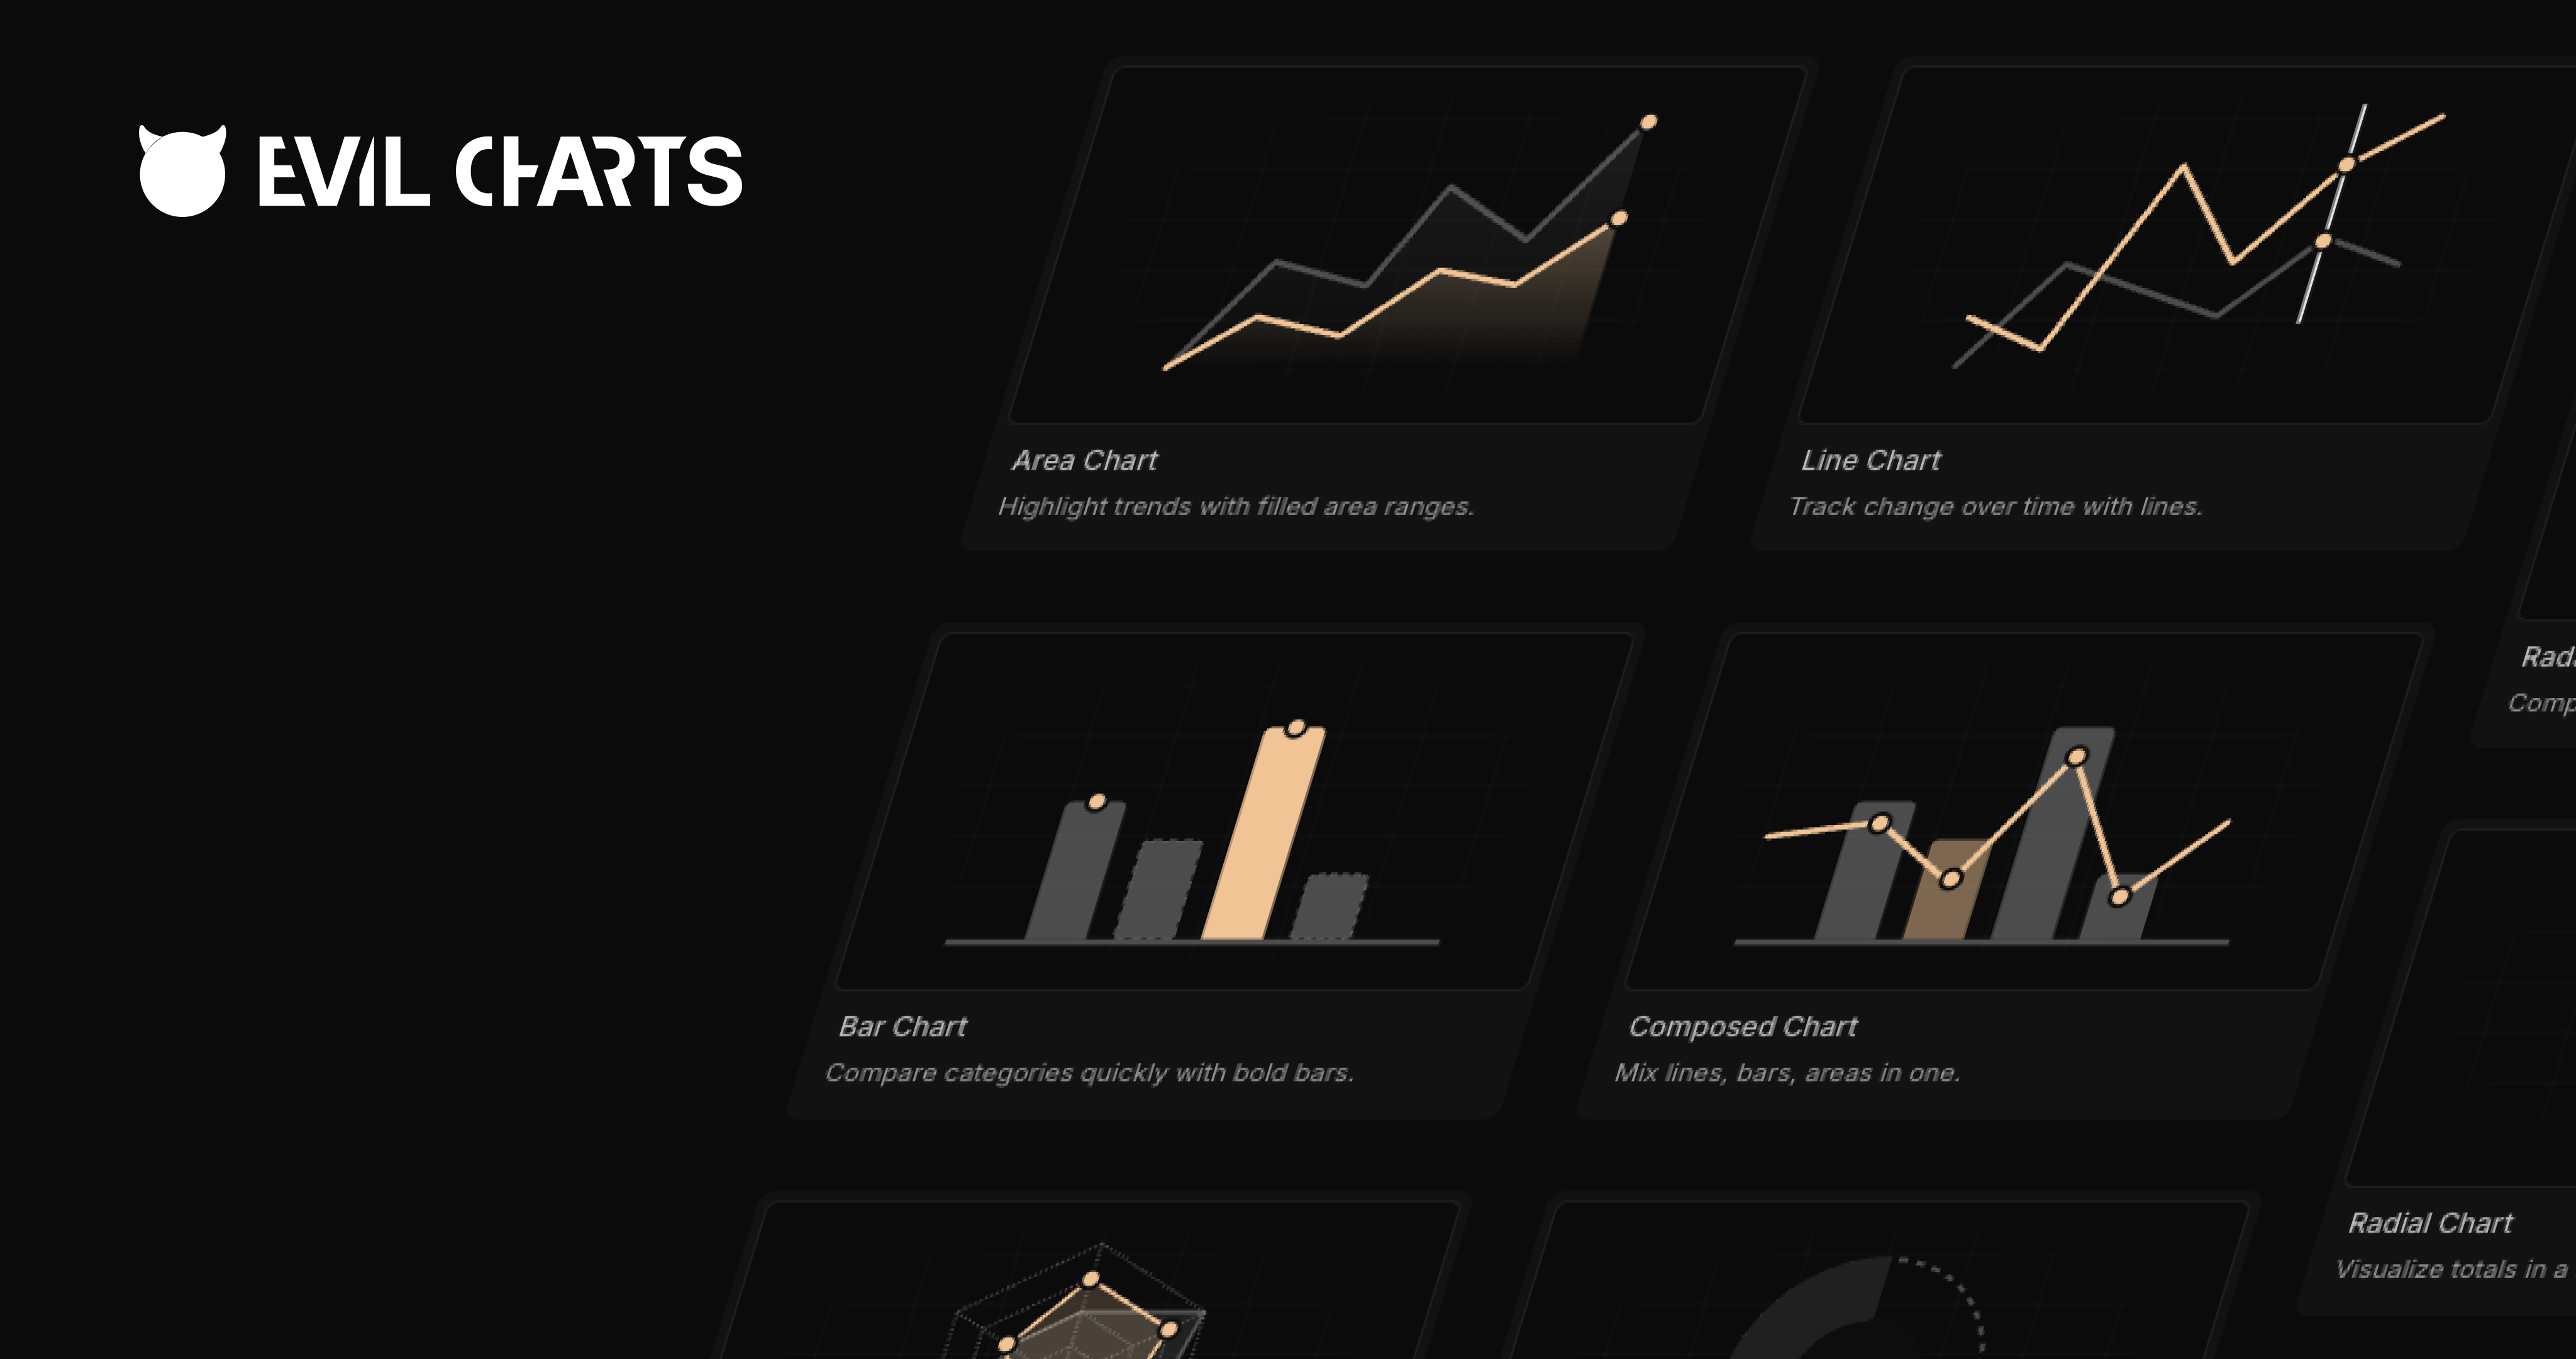
Evil Charts is a set of free, open-source animated chart components for React. Recharts and Apache ECharts underneath, shadcn/ui and Tailwind on the surface. Copy, paste, ship.
Why it stays bookmarked
Stock charts have a look, and it is never the look of the product around them. I open Evil Charts when a dashboard needs a chart that already speaks the same visual language as the cards and tables, including a bit of motion, so I’m not theming a default for an hour.
Watermelon UI and Shadcn Space are where the rest of that dashboard usually comes from. Plate is the other hard widget I refuse to build from a textarea.