What is eBPF? Safe programs inside the Linux kernel, explained
eBPF lets you run small, verified programs inside the Linux kernel without writing a kernel module. How the verifier, maps and hooks work, with bpftrace.
eBPF is a way to run small, sandboxed programs inside the Linux kernel, attached to events such as a system call, a function entry or a network packet, without changing kernel source or loading a kernel module. Before a program runs, an in-kernel verifier proves it will terminate and will not touch memory it should not, then a JIT compiler turns it into native machine code. That combination is why observability, networking and security tools can now do kernel-level work in production without the risk profile of a driver.
The ebpf.io overview says the name no longer stands for anything. It started as BPF, the Berkeley Packet Filter, from a USENIX Winter 1993 paper by Steven McCanne and Van Jacobson at Lawrence Berkeley Laboratory. That BPF was a tiny virtual machine for deciding which packets tcpdump should copy to user space. The extended version is a general-purpose one.
How did BPF turn into eBPF?
The packet filter stayed a packet filter for twenty years. Then Linux grew a new instruction set and a syscall around it. Kernelnewbies’ notes for Linux 3.18, released December 7, 2014, describe the new bpf() syscall as “a multiplexor for a range of different operations on eBPF”, a “universal in-kernel virtual machine”. The same notes give the model that still holds: programs are written in a restricted subset of C, compiled to eBPF bytecode, loaded by a user process, checked by a verifier that “statically determines that the program terminates and is safe to execute”, and attached to events such as packets and tracepoints.
Brendan Gregg’s eBPF page credits Alexei Starovoitov and Daniel Borkmann with leading the development, and lists the 4.x kernel series as where most of the tracing features landed. In August 2021 Meta, Google, Isovalent, Microsoft and Netflix launched the eBPF Foundation under the Linux Foundation, which tells you who depends on it.
How does eBPF work?
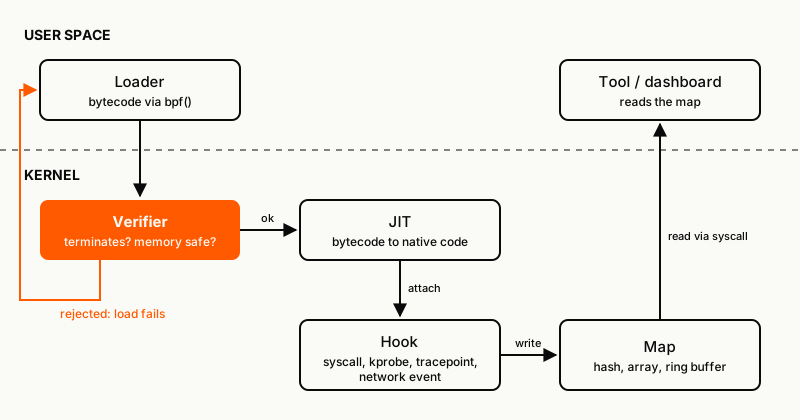
Five pieces, in the order a program meets them.
- Hooks. A program attaches to an event. The ebpf.io overview lists predefined hooks for system calls, function entry and exit, kernel tracepoints and network events, plus kprobes and uprobes, which can attach to almost any kernel or user-space function when no predefined hook exists.
- The verifier. The kernel refuses to load a program it cannot prove safe. More on this below, because it is the whole point.
- The JIT compiler. Verified bytecode is translated to the host’s instruction set, so the program runs at roughly the speed of native kernel code.
- Maps. Programs keep state in maps: hash tables, arrays, LRU tables, ring buffers, stack traces. In the overview’s words, maps “can be accessed from eBPF programs as well as from applications in user space via a system call.” This is how a kernel-side counter reaches your dashboard.
- Helpers. “eBPF programs cannot call into arbitrary kernel functions.” They call a fixed helper API instead: read the time, look up a map, get the current process or cgroup, rewrite a packet.
What does the eBPF verifier check?
The kernel’s verifier documentation describes two passes. The first is a control-flow check that historically rejected loops and unreachable instructions outright. The second “starts from the first insn and descends all possible paths”, simulating every instruction and tracking the type of every register and stack slot.
That simulation is strict in ways that shape how people write eBPF:
- A register that was never written cannot be read.
- The stack can be read only after it was written, and only within its fixed bound.
- The result of a map lookup is typed as “pointer to a value or NULL”, and the program is rejected unless it checks for NULL before dereferencing.
- References to sockets must be released on every path.
The rules loosened as the verifier got smarter. LWN reported in July 2019 that the 5.2 kernel raised the size limit from 4,096 instructions to one million, and that a patch set from Starovoitov merged for 5.3 allowed bounded loops, which the verifier handles by simulating the iterations.
One sentence on ebpf.io is the one I would make every platform team read: the verifier is a safety tool, not a security tool inspecting what programs are doing. It proves a program will not crash or hang the kernel. It does not judge whether a program that reads every file path opened on the box is a good idea. Loading eBPF still needs privilege, and anyone with that privilege can see a lot.
What does an eBPF program look like?
The quickest way to feel it is bpftrace, a high-level tracing language that compiles one-liners to eBPF. Gregg’s page notes it was created by Alastair Robertson and is used in production at Netflix and Facebook. These two one-liners are from his eBPF page, and need root on a Linux box with bpftrace installed:
# Count system calls by process name until Ctrl-C, then print the map.
bpftrace -e 'tracepoint:raw_syscalls:sys_enter { @[comm] = count(); }'

# Print every file open with the process that opened it.
bpftrace -e 'tracepoint:syscalls:sys_enter_open { printf("%s %s\n", comm, str(args->filename)); }'
Read the first one as a full eBPF program. tracepoint:raw_syscalls:sys_enter is the hook. comm is a helper call that returns the current process name. @[comm] = count() declares a hash map keyed by process name and increments it in the kernel on every syscall. When you stop it, bpftrace reads the map from user space and prints it. No events cross into user space one by one; only the aggregate does, which is why this is cheap enough to run on a busy server.
On recent kernels and C libraries most file opens go through openat, so the second one-liner may print little; the matching tracepoint is syscalls:sys_enter_openat. I am not pasting output here because I wrote this on a Mac, and fake kernel traces are worse than none.
Below bpftrace sit bcc (Python front end, C programs compiled at runtime) and libbpf (C programs compiled ahead of time). Go, Rust (aya, libbpf-rs) and Java libraries exist too, per ebpf.io. The bpftrace one-liner and a 200-line libbpf program are the same thing underneath: a hook, a verifier pass, a map.
What is eBPF used for?
Three categories, all in production now.
Observability. Tracing and profiling without restarting or recompiling the target. This is where bcc and bpftrace live, and where a lot of continuous profilers and network flow tools get their data. It complements OpenTelemetry: OTel is the format and pipeline for telemetry your code emits, eBPF can collect telemetry your code never thought to emit.
Networking. Programs attached to network events can inspect and rewrite packets inside the kernel, using the packet helpers, before user space ever sees them. Cilium uses eBPF for Kubernetes networking and can fully replace kube-proxy, the component that implements Service routing. The CNCF announced Cilium’s graduation on October 11, 2023.
Security. Runtime detection that watches syscalls, process execution and file access from inside the kernel, and enforcement that can block them.
Why does eBPF matter to a builder?
Because it moved kernel extension from “write a module and pray” to “write a program the kernel checks first”. A kernel module that dereferences a bad pointer takes the machine down. An eBPF program that might dereference a bad pointer never loads.
That difference is the strongest argument I know for eBPF in security agents and anything else that ships kernel-level code to a fleet. The CrowdStrike outage of July 2024 was a crash in kernel-mode security code on Windows; I cover it, and the rollout lessons, in that post. A verifier is a type of pre-flight check that a driver does not get. It does not replace staged rollouts, and it does not cover the user-space half of an agent, but it removes one entire class of crash.
From a data-platform seat, the line I would circle is visibility without code changes. On a large fleet, the slow query or the noisy neighbor is often in a service whose owners are busy. eBPF lets you measure it from the host, with their consent, without a redeploy.
Where does eBPF break?
Kernel versions. Features arrived across many releases: tracing mostly in 4.x, bounded loops in 5.3, larger programs in 5.2. Your fleet’s oldest kernel decides what you can run. Check before you design around a feature.
The verifier says no. Valid C is not always verifiable C. Expect to restructure code: explicit NULL checks, bounded loops, smaller functions, fewer branches. The error messages are long register-state dumps that take practice to read.
Privilege. Loading programs generally needs elevated capabilities, and a loaded tracer can read sensitive data passing through the kernel: file paths, arguments, packet payloads. Treat eBPF tooling access like root access. From a privacy-compliance seat, I would want an inventory of which eBPF programs run on hosts that process personal data, and what their maps contain.
Overhead is not zero. A program on a hot path such as every syscall or every packet runs millions of times a second. Aggregate in the kernel, filter early and measure before rolling out.
Linux first. The tooling and the documentation assume Linux. Do not plan a cross-platform agent on eBPF alone.
What I would do
- Start with bpftrace on a staging host to answer a real question: which process makes the most syscalls, which files a service opens, where latency hides. One-liners teach the model faster than any tutorial.
- For anything that ships, use a maintained project (Cilium for networking, an established profiler or security agent) rather than writing eBPF from scratch. The verifier and kernel-version matrix is real work.
- Inventory your fleet’s kernel versions before committing to an eBPF-based tool.
- Put eBPF loading behind the same access controls as root, log who loaded what, and review maps for personal data.
- Roll eBPF tooling out like any other host-level change: canary hosts first, then rings. The verifier prevents a kernel crash; it does not prevent a bad policy from dropping traffic.
- If you run untrusted code, eBPF is one layer of agent sandboxing, not the sandbox itself.
FAQ
What does eBPF stand for?
It began as “extended Berkeley Packet Filter”, but ebpf.io now says eBPF is a standalone term that doesn’t stand for anything, because it does far more than filter packets.
Is eBPF safe to run in production?
The verifier guarantees a loaded program terminates and does not access memory out of bounds, so it cannot crash the kernel the way a buggy module can. It does not guarantee the program is harmless or cheap. Treat it as privileged code and roll it out in stages.
What is the difference between eBPF and a kernel module?
A kernel module is arbitrary native code with full kernel access and no pre-load checks. An eBPF program is bytecode that the kernel verifies before loading, can only call a fixed set of helper functions, and is unloaded automatically when the process that loaded it exits, per the Linux 3.18 notes.
What is the difference between bpftrace and bcc?
bpftrace is a high-level language for one-liners and short scripts. bcc is a toolkit for writing tools with a Python front end and C kernel programs. Both compile to eBPF and both are used in production.
Does eBPF work on Windows?
eBPF grew up in Linux and the major tools assume it. Microsoft was a founding member of the eBPF Foundation, but check any tool’s platform support before planning around it.
Sources
- eBPF.io, What is eBPF?, accessed October 2026
- Linux kernel documentation, eBPF verifier
- Kernelnewbies, Linux 3.18, released December 7, 2014
- McCanne and Jacobson, The BSD Packet Filter: A New Architecture for User-level Packet Capture, USENIX Winter 1993
- Brendan Gregg, Linux eBPF Tracing Tools
- LWN, Bounded loops in BPF for the 5.3 kernel, July 31, 2019
- Linux Foundation, Meta, Google, Isovalent, Microsoft and Netflix launch eBPF Foundation, August 12, 2021
- Cilium docs, Kubernetes without kube-proxy
- CNCF, Cloud Native Computing Foundation announces Cilium graduation, October 11, 2023